
Page 137 - Atlas 2024 - (14-02-2025)
P. 137
ELECTION COMMISSION OF INDIA
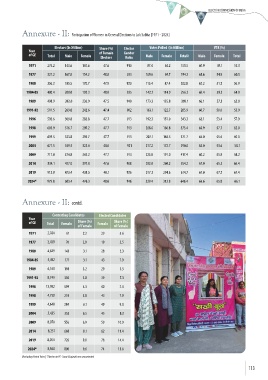
Annexure - II: Participation of Women in General Elections to Lok Sabha [1971 - 2024]
Electors (In Million) Share (%) Elector Votes Polled (In Million) VTR (%)
Year
of GE Total Male Female of Female Gender Male Female Total# Male Female Total
Electors Ratio
1971 274.2 143.6 130.6 47.6 910 87.4 64.2 151.5 60.9 49.1 55.3
1977 321.2 167.0 154.2 48.0 923 109.6 84.7 194.3 65.6 54.9 60.5
1980 356.2 185.5 170.7 47.9 920 115.4 87.4 202.8 62.2 51.2 56.9
1984-85 400.4 208.0 192.3 48.0 925 142.3 114.0 256.3 68.4 59.3 64.0
1989 498.9 262.0 236.9 47.5 940 173.3 135.8 309.1 66.1 57.3 62.0
1991-92 511.5 269.0 242.6 47.4 902 163.1 122.7 285.9 60.7 50.6 55.9
1996 592.6 309.8 282.8 47.7 913 192.3 151.0 343.3 62.1 53.4 57.9
1998 605.9 316.7 289.2 47.7 913 208.6 166.8 375.4 65.9 57.7 62.0
1999 619.5 323.8 295.7 47.7 913 207.1 164.5 371.7 64.0 55.6 60.0
2004 671.5 349.5 322.0 48.0 921 217.2 172.7 390.0 62.0 53.6 58.1
2009 717.0 374.8 342.2 47.7 913 225.8 191.0 417.4 60.2 55.8 58.2
2014 834.1 437.0 397.0 47.6 908 292.8 260.2 554.2 67.0 65.5 66.4
2019 912.0 473.4 438.5 48.1 926 317.3 294.6 614.7 67.0 67.2 67.4
2024* 979.8 503.4 476.3 48.6 946 329.4 312.8 646.4 65.6 65.8 66.1
Annexure - II: contd.
Contesting Candidates Elected Candidates
Year
of GE Total Female Share (%) Female Share (%)
of Female of Female
1971 2,784 61 2.2 29 5.6
1977 2,439 70 2.9 19 3.5
1980 4,629 143 3.1 28 5.3
1984-85 5,492 171 3.1 43 7.9
1989 6,160 198 3.2 29 5.5
1991-92 8,749 330 3.8 39 7.3
1996 13,952 599 4.3 40 7.4
1998 4,750 274 5.8 43 7.9
1999 4,648 284 6.1 49 9.0
2004 5,435 355 6.5 45 8.3
2009 8,070 556 6.9 59 10.9
2014 8,251 668 8.1 62 11.4
2019 8,054 726 9.0 78 14.4
2024* 8,360 800 9.6 74 13.6
#Including Postal Votes | *Election in PC- Surat (Gujarat) was uncontested
113