
Page 136 - Atlas 2024 - (14-02-2025)
P. 136
AN ATLAS | LOK SABHA ELECTIONS 2024
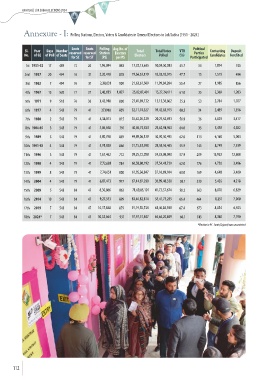
Annexure - I: Polling Stations, Electors, Voters & Candidates in General Elections to Lok Sabha [1951 - 2024]
Seats Seats Polling Avg No. of Political
Sl. Year Days Number Total Total Votes VTR Contesting Deposit
No. of GE of Poll of Seats reserved reserved Station Electors Electors Polled (%) Parties Candidates Fore ted
for SC for ST [PS] per PS Participated
1st 1951-52 17 489 72 26 1,96,084 883 17,32,13,635 10,59,50,083 45.7 53 1,874 745
2nd 1957 20 494 76 31 2,20,478 878 19,36,52,179 12,05,13,915 47.7 15 1,519 494
3rd 1962 7 494 76 31 2,38,031 909 21,63,61,569 11,99,04,284 55.4 27 1,985 856
4th 1967 13 520 77 37 2,43,693 1,027 25,02,07,401 15,27,24,611 61.0 25 2,369 1,203
5th 1971 9 518 76 36 3,42,918 800 27,41,89,132 15,15,36,802 55.3 53 2,784 1,707
6th 1977 4 543 79 41 373910 859 32,11,74,327 19,42,63,915 60.5 34 2,439 1,356
7th 1980 2 543 79 41 4,36,813 815 35,62,05,329 20,27,52,893 56.9 36 4,629 3,417
8th 1984-85 3 543 79 41 5,06,058 791 40,03,75,333 25,62,94,963 64.0 35 5,492 4,382
9th 1989 3 543 79 41 5,80,798 859 49,89,06,129 30,90,50,495 62.0 113 6,160 5,003
10th 1991-92 4 543 79 41 5,91,020 866 51,15,33,598 28,58,56,465 55.9 145 8,749 7,539
11th 1996 3 543 79 41 7,67,462 772 59,25,72,288 34,33,08,090 57.9 209 13,952 12,688
12th 1998 4 543 79 41 7,72,681 784 60,58,80,192 37,54,41,739 62.0 176 4,750 3,486
13th 1999 8 543 79 41 7,74,651 800 61,95,36,847 37,16,69,104 60.0 169 4,648 3,400
14th 2004 4 543 79 41 6,87,473 977 67,14,87,930 38,99,48,330 58.1 230 5,435 4,218
15th 2009 5 543 84 47 8,30,866 863 71,69,85,101 41,73,57,674 58.2 363 8,070 6,829
16th 2014 10 543 84 47 9,27,553 899 83,40,82,814 55,41,75,255 66.4 464 8,251 7,000
17th 2019 7 543 84 47 10,37,848 879 91,19,50,734 61,46,84,398 67.4 673 8,054 6,923
18th 2024* 7 543 84 47 10,52,664 931 97,97,51,847 64,64,20,869 66.1 743 8,360 7,190
*Election in PC- Surat (Gujarat) was uncontested
112