Page 75 - Atlas 2024 - (14-02-2025)
P. 75

ELECTION COMMISSION OF INDIA


            Elector Gender Ratio (STATE/UT WISE)
                                                                                                                 Fact
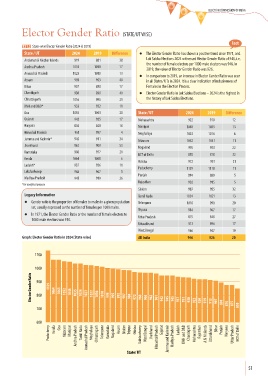
            T21.2 State-wise Elector Gender Ratio [2024 & 2019]
             State / UT             2024      2019     Difference    l The Elector Gender Ratio has shown a positive trend since 1971, and
             Andaman & Nicobar Islands  919    881         38           Lok Sabha Elections 2024 witnessed Elector Gender Ratio of 946, i.e.
                                                                        the number of female electors per 1000 male electors was 946. In
             Andhra Pradesh         1035       1018        17
                                                                        2019, the value of Elector Gender Ratio was 926.
             Arunachal Pradesh      1023       1010        13
                                                                    l  In comparison to 2019, an increase in Elector Gender Ratio was seen
             Assam                   993       953         40           in all States/ UTs in 2024. It is a clear indication of inclusiveness of
             Bihar                   907       890         17           Females in the Election Process.
             Chandigarh              930       890         40       l Elector Gender Ratio in Lok Sabha Elections – 2024 is the highest in
             Chhattisgarh           1016       995         21           the history of Lok Sabha Elections.

             DNH and D&D*            933       922         11
             Goa                    1063       1043        20       State / UT             2024      2019     Difference
             Gujarat                 942       925         17       Maharashtra             922        910       12
             Haryana                 876       858         18       Manipur                1048       1035       13

             Himachal Pradesh        961       957          4       Meghalaya              1022       1016        6
             Jammu and Kashmir*      945       911         34
                                                                    Mizoram                1052       1041        11
             Jharkhand               962       909         53       Nagaland                995        973       22
             Karnataka               998       977         21
                                                                    NCT of Delhi            850        818       32
             Kerala                 1064       1058         6
                                                                    Odisha                  972        951        21
             Ladakh*                 937       926         11
                                                                    Puducherry             1129       1118        11
             Lakshadweep             968       967          1
                                                                    Punjab                  894        889        5
             Madhya Pradesh          945       919         26
                                                                    Rajasthan               920        915        5
            *For analytical purpose
                                                                    Sikkim                  987        955       32
             Legacy Information                                     Tamil Nadu             1034       1021       13
             l Gender ratio is the proportion of females to males in a given population   Telangana  1010  990   20
                set, usually expressed as the number of females per 1000 males.
                                                                    Tripura                 984        967       17
             l In 1971, the Elector Gender Ratio or the number of female electors to
                                                                    Uttar Pradesh           875        848       27
                1000 male electors was 910.
                                                                    Uttarakhand             913        896       17
                                                                    West Bengal             966        947       19
            Graph: Elector Gender Ratio in 2024 [State-wise]        All India               946       926        20


                  1100


                  1000
                Elector Gender Ratio  900  1129  1064  1063  1052  1048  1035  1034  1023  1022  1016  1010  998  995  993  987  984  972  968  966  962  961


                   800


                   700                                                          942  945  945  937  933  930  922  920  919  913  907  894  876  875  850


                   600
                         Puducherry  Kerala  Goa  Mizoram  Manipur  Andhra Pradesh  Tamil Nadu  Arunachal Pradesh  Meghalaya  Chhattisgarh  Telangana  Karnataka  Nagaland  Assam  Sikkim  Tripura  Odisha  Lakshadweep  West Bengal  Jharkhand  Himachal Pradesh  Gujarat  Jammu and Kashmir  Madhya Pradesh  Ladakh  DNH and D&D  Chandigarh  Maharashtra  Rajasthan  A & N Islands  Uttarakhand  Bihar   Punjab  Haryana  Uttar Pradesh  NCT of Delhi


                                                              State/ UT


                                                                                                                         51
   70   71   72   73   74   75   76   77   78   79   80