
Page 84 - Atlas 2024 - (14-02-2025)
P. 84
AN ATLAS | LOK SABHA ELECTIONS 2024
25
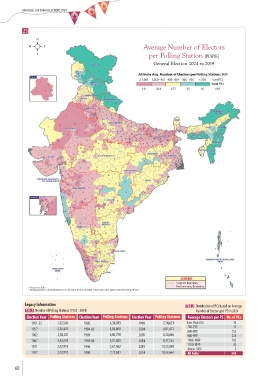
Average Number of Electors
per Polling Station (PC WISE)
General Election 2024 vs 2019
Legacy Information T25.2 Distribution of PCs based on Average
T25.1 Number of Polling Stations (1951 - 2024) Number of Electors per PS in 2024
Election Year Polling Stations Election Year Polling Stations Election Year Polling Stations Average Electors per PS No. of PCs
1951-52 1,32,560 1980 4,36,813 1999 7,74,651 Less than 700 16
700-799 15
1957 2,20,478 1984-85 5,06,058 2004 6,87,473
800-899 152
1962 2,38,031 1989 5,80,798 2009 8,30,866 900-999 235
1967 2,43,693 1991-92 5,91,020 2014 9,27,553 1000-1099 102
1100-1199 20
1971 3,42,918 1996 7,67,462 2019 10,37,848
Above 1200 3
1977 3,73,910 1998 7,72,681 2024 10,52,664 All India 543
60