
Page 71 - ECI Atlas
P. 71
LOK SABHA ELECTIONS 2019
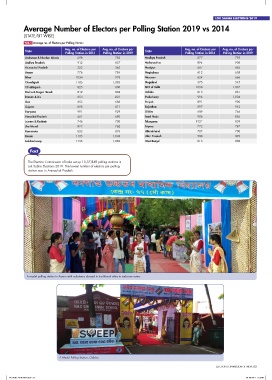
Average Number of Electors per Polling Station 2019 vs 2014
(STATE/UT WISE)
T26.1 Average no. of Electors per Polling Station
Avg. no. of Electors per Avg. no. of Electors per Avg. no. of Electors per Avg. no. of Electors per
State State
Polling Station in 2014 Polling Station in 2019 Polling Station in 2014 Polling Station in 2019
Andaman & Nicobar Islands 698 782 Madhya Pradesh 877 795
Andhra Pradesh 912 857 Maharashtra 894 908
Arunachal Pradesh 352 365 Manipur 667 685
Assam 776 784 Meghalaya 612 605
Bihar 1034 979 Mizoram 624 666
Chandigarh 1185 1,083 Nagaland 575 545
Chhattisgarh 825 800 NCT of Delhi 1058 1,037
Dadra & Nagar Haveli 819 868 Odisha 813 861
Daman & Diu 854 801 Puducherry 996 1,004
Goa 653 688 Punjab 891 900
Gujarat 895 871 Rajasthan 897 942
Haryana 991 929 Sikkim 689 766
Himachal Pradesh 651 690 Tamil Nadu 906 885
Jammu & Kashmir 746 700 Telangana 912* 859
Jharkhand 822 760 Tripura 772 787
Karnataka 852 878 Uttarakhand 707 700
Kerala 1135 1,049 Uttar Pradesh 988 899
Lakshadweep 1135 1,082 West Bengal 813 888
Fact
The Election Commission of India set up 10,37,848 polling stations in
Lok Sabha Elections 2019. The lowest number of electors per polling
station was in Arunachal Pradesh.
A model polling station in Assam with volunteers dressed in traditional attire to welcome voters
A Model Polling Station, Odisha
ELECTION COMMISSION OF INDIA | 53
29-06-2021 11:33:42
ECI Atlas-28-06-2021.indd 53
ECI Atlas-28-06-2021.indd 53 29-06-2021 11:33:42