Page 127 - Atlas 2024 - (14-02-2025)
P. 127

ELECTION COMMISSION OF INDIA


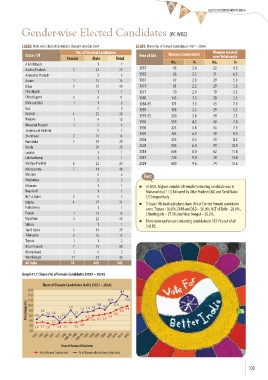
            Gender-wise Elected Candidates (PC-WISE)

            T41.1 State wise Elected Candidates [Gender-wise] in 2024  T41.2 Share (%) of Female Candidates [1957 – 2024]
                                      No. of Elected Candidates                                         Women elected
             State / UT                                             Year of GEs   Women Contestants     over Total seats
                                 Female       Male       Total
                                                                                    No.       %         No.       %
             A & N Islands                      1           1
             Andhra Pradesh         3          22          25       1957             45       3.0       22        4.5
             Arunachal Pradesh                  2           2       1962             66       3.3       31        6.3
             Assam                  1          13          14       1967             67       2.8       29        5.6
             Bihar                  5          35          40       1971             61       2.2       29        5.6
             Chandigarh                         1           1       1977             70       2.9       19        3.5
             Chhattisgarh           3           8          11       1980            143       3.1       28        5.3
             DNH and D&D            1           1           2       1984-85         171       3.1       43        7.9
             Goa                                2           2       1989            198       3.2       29        5.5
             Gujarat                4          22          26       1991-92         330       3.8       39        7.3
             Haryana                1           9          10       1996            599       4.3       40        7.4
             Himachal Pradesh       1           3           4
                                                                    1998            274       5.8       43        7.9
             Jammu and Kashmir                  5           5
                                                                    1999            284       6.1       49        9.0
             Jharkhand              2          12          14
             Karnataka              3          25          28       2004            355       6.5       45        8.3
             Kerala                            20          20       2009            556       6.9       59       10.9
             Ladakh                             1           1       2014            668       8.0       62       11.4
             Lakshadweep                        1           1       2019            726       9.0       78       14.4
             Madhya Pradesh         6          23          29       2024            800       9.6       74       13.6
             Maharashtra            7          41          48
             Manipur                            2           2          Fact
             Meghalaya                          2           2
             Mizoram                            1           1       l In 2024, highest number of Female Contesting candidate was in
             Nagaland                           1           1           Maharashtra [111] followed by Uttar Pradesh [80] and Tamil Nadu
             NCT of Delhi           2           5           7           [77] respectively.
             Odisha                 4          17          21       l 5 State/ UTs having highest share (%) of Elected Female candidates
             Puducherry                         1           1           were: Tripura - 50.0%, DNH and D&D – 50.0%, NCT of Delhi - 28.6%,
             Punjab                 1          12          13           Chhattisgarh – 27.3% and West Bengal – 26.2%.
             Rajasthan              3          22          25
                                                                    l There were no Female Contesting candidates in 152 PCs out of all
             Sikkim                             1           1
                                                                        543 PC.
             Tamil Nadu             5          34          39
             Telangana              2          15          17
             Tripura                1           1           2
             Uttar Pradesh          7          73          80
             Uttarakhand            1           4           5
             West Bengal            11         31          42
             All India             74         469         543

            Graph 41.1: Share (%) of Female Candidates [1957 – 2024]


                      Share of Female Candidates in GEs [1957 – 2024]
               16.0
                                                           14.4
               14.0
               12.0                             9.0  10.9  11.4  13.6
              Percentage (%)  8.0  6.3  5.6 5.6  5.3  7.9  5.5  7.3  7.4 7.9  8.3  8.0  9.0  9.6
               10.0

               6.0 4.5
               4.0        2.2  3.5  3.1   4.3  5.8  6.1 6.5  6.9
               2.0   3.3             3.2  3.8
                  3.0  2.8   2.9 3.1
               0.0
                 1957  1962  1967  1971  1977  1980 1984-85  1989 1991-92  1996  1998  1999  2004  2009  2014  2019  2024

                               Year of General Elections
                    % of Women Contestants  % of Women elected over total seats


                                                                                                                         103
   122   123   124   125   126   127   128   129   130   131   132