
Page 93 - Atlas 2024 - (14-02-2025)
P. 93
ELECTION COMMISSION OF INDIA
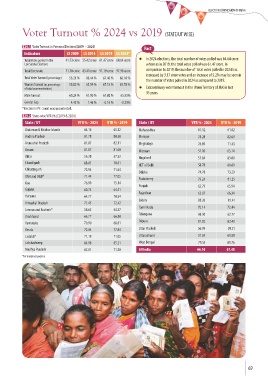
Voter Turnout % 2024 vs 2019 (STATE/UT WISE)
T29.1 Voter Turnout in Previous Elections [2009 – 2024]
Fact
Indicators LS 2009 LS 2014 LS 2019 LS 2024*
Total Votes polled in the 41.73 crore 55.42 crore 61.47 crore 64.64 crore l In 2024 elections, the total number of votes polled was 64.64 crore
Lok Sabha Elections where as in 2019, the total votes polled was 61.47 crore. In
Total Electorate 71.70 crore 83.41 crore 91.19 crore 97.98 crore comparison to 2019, the number of total votes polled in 2024 has
increased by 3.17 crore votes and an increase of 5.2% may be seen in
Total Voter Turnout (percentage) 58.21 % 66.44 % 67.40 % 66.10 %
the number of votes polled in 2024 as compared to 2019.
Women Turnout (as percentage 55.82 % 65.54 % 67.18 % 65.78 %
of total women electors) l Extraordinary voter turnout in the Union Territory of J&K in last
35 years.
Male Turnout 60.24 % 67.00 % 67.02 % 65.55%
Gender Gap 4.42 % 1.46 % -0.16 % -0.23%
*Election in PC- Surat was uncontested.
T29.2 State-wise VTR (%) [2019 & 2024]
State / UT VTR % - 2024 VTR % - 2019 State / UT VTR % - 2024 VTR % - 2019
Andaman & Nicobar Islands 64.16 65.12 Maharashtra 61.52 61.02
Andhra Pradesh 81.78 80.38 Manipur 78.28 82.69
Arunachal Pradesh 81.07 82.11 Meghalaya 76.89 71.43
Assam 81.87 81.60 Mizoram 57.10 63.14
Bihar 56.28 57.33 Nagaland 57.84 83.00
Chandigarh 68.03 70.61
NCT of Delhi 58.78 60.60
Chhattisgarh 72.94 71.64
Odisha 74.78 73.29
DNH and D&D* 71.44 77.05
Puducherry 79.24 81.25
Goa 76.99 75.14
Punjab 62.79 65.94
Gujarat 60.74 64.51
Rajasthan 62.07 66.34
Haryana 64.77 70.34
Sikkim 83.26 81.41
Himachal Pradesh 71.45 72.42
Tamil Nadu 70.14 72.44
Jammu and Kashmir* 58.65 44.37
Telangana 66.30 62.77
Jharkhand 66.77 66.80
Tripura 81.82 82.40
Karnataka 70.90 68.81
Kerala 72.04 77.84 Uttar Pradesh 56.99 59.21
Ladakh* 71.19 71.05 Uttarakhand 57.69 61.88
Lakshadweep 84.98 85.21 West Bengal 79.55 81.76
Madhya Pradesh 67.01 71.20 All India 66.10 67.40
*For analytical purpose
69