
Page 83 - ECI Atlas
P. 83
LOK SABHA ELECTIONS 2019
Voter Turnout % 2019 vs 2014
(STATE/UT WISE)
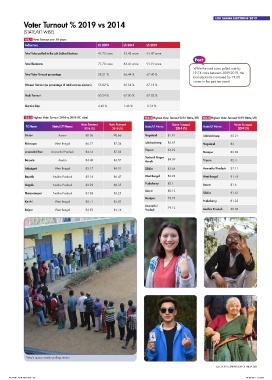
T32.1 Voter Turnout over 10 years
Indicators LS 2009 LS 2014 LS 2019
Total Votes polled in the Lok Sabha Elections 41.73 crore 55.42 crore 61.47 crore
Fact
Total Electorate 71.70 crore 83.41 crore 91.19 crore
While the total votes polled rose by
Total Voter Turnout percentage 58.21 % 66.44 % 67.40 % 19.74 crore between 2009-2019, the
total electorate increased by 19.50
crores in the past ten years!
Women Turnout (as percentage of total women electors) 55.82 % 65.54 % 67.18 %
Male Turnout 60.24 % 67.00 % 67.02 %
Gender Gap 4.42 % 1.46 % -0.16 %
T32.2 Highest Voter Turnout 2014 vs 2019 (PC wise) T32.3 Highest Voter Turnout 2014 (State/UT) T32.4 Highest Voter Turnout 2019 (State/UT)
Voter Turnout Voter Turnout Voter Turnout Voter Turnout
PC Name State/UT Name State/UT Name State/UT Name
2014 (%) 2019 (%) 2014 (%) 2019 (%)
Dhubri Assam 88.36 90.66 Nagaland 87.91 Lakshadweep 85.21
Bishnupur West Bengal 86.72 87.34 Lakshadweep 86.62 Nagaland 83
Tripura 84.92
Arunachal East Arunachal Pradesh 84.16 87.03 Manipur 82.69
Dadra & Nagar
Barpeta Assam 84.40 86.57 Haveli 84.09 Tripura 82.4
Jalpaiguri West Bengal 85.17 86.51 Sikkim 83.64 Arunachal Pradesh 82.11
Bapatla Andhra Pradesh 85.16 86.47 West Bengal 82.22 West Bengal 81.76
Puducherry 82.1
Ongole Andhra Pradesh 82.23 86.35 Assam 81.6
Assam 80.12
Narasaraopet Andhra Pradesh 84.68 86.25 Sikkim 81.41
Manipur 79.75
Kanthi West Bengal 86.71 85.83 Puducherry 81.25
Arunachal
Bolpur West Bengal 84.83 85.74 Pradesh 79.12 Andhra Pradesh 80.38
Voter’s queue outside polling station
ELECTION COMMISSION OF INDIA | 65
29-06-2021 11:37:01
ECI Atlas-28-06-2021.indd 65
ECI Atlas-28-06-2021.indd 65 29-06-2021 11:37:01